

Work
Don’t take our word for it. Try the demos yourself.
Built for the way small law and accounting firms run, on sample data: sound methods, checked numbers and findings in plain language.
Automation
A monthly report, checked before it is sent.
The Monthly Firm Brief
Goal: get paid faster and stop unbilled work slipping, with every partner briefed on the first working day.
On the first working day of each month, the job pulls the month's billing data, runs its checks, and prepares the partner brief. If a check fails, nothing is sent and a person is alerted. Its checks reconcile invoices against payments. The brief then compares every figure with a year earlier and flags overdue invoices, unbilled work, heavy deadline weeks and rates falling behind the market. An accounting practice gets the same brief with engagements in place of matters.
Read the October 2026 brief →- Latest
- Oct 2026
- Invoiced
- $210,952 (+13% on Oct 2025)
- Flagged
- 4 items worth a look
Written November 2, 2026 · market panel: BLS producer price indexes, retrieved from FRED
Want to see what this looks like with your numbers? Start with a Quick-Start Data & Automation Assessment, in two weeks.
Start with the assessmentDemos
Email, records, calendar, team. Connected.
An email arrives and AI reads it into a fixed form. From there, fixed rules take over: plain, written-down checks that compare each value with your records, update them, put any deadline on the calendar and tell the right person in the team channel. The AI never decides where anything goes. Try it on the business closest to yours.
Built for your firm, the same workflow runs on n8n, with records and the audit trail in Supabase and the checking logic in Python, all inside accounts you own.
- Sample workflow
Law firm
New-client enquiries screened for possible conflicts, with every match sent to a lawyer to clear, vendor invoices matched to matters, client questions sent to the right lawyer.
Open the demo → - Sample workflow
Accounting practice
Tax forms filed to the right client’s return, duplicates and unknown senders caught, an IRS notice with three days left flagged.
Open the demo → - Sample workflow
Online shop
Returns checked against the order and the 30-day window, supplier invoices against purchase orders, a suspicious invoice held.
Open the demo →
Want to see what this looks like with your numbers? Start with a Quick-Start Data & Automation Assessment, in two weeks.
Start with the assessmentWorks with data from
- QuickBooks
- Clio
- Salesforce
- Shopify
- Gmail and Outlook
- Slack and Teams
Built with
- n8n
- Supabase
- Python
- Tableau
- Power BI
- Streamlit
Clio and QuickBooks are trademarks of their owners. Rada AI Consulting is not affiliated with or endorsed by them.
Dashboards
Goal, data, dashboard, insight.
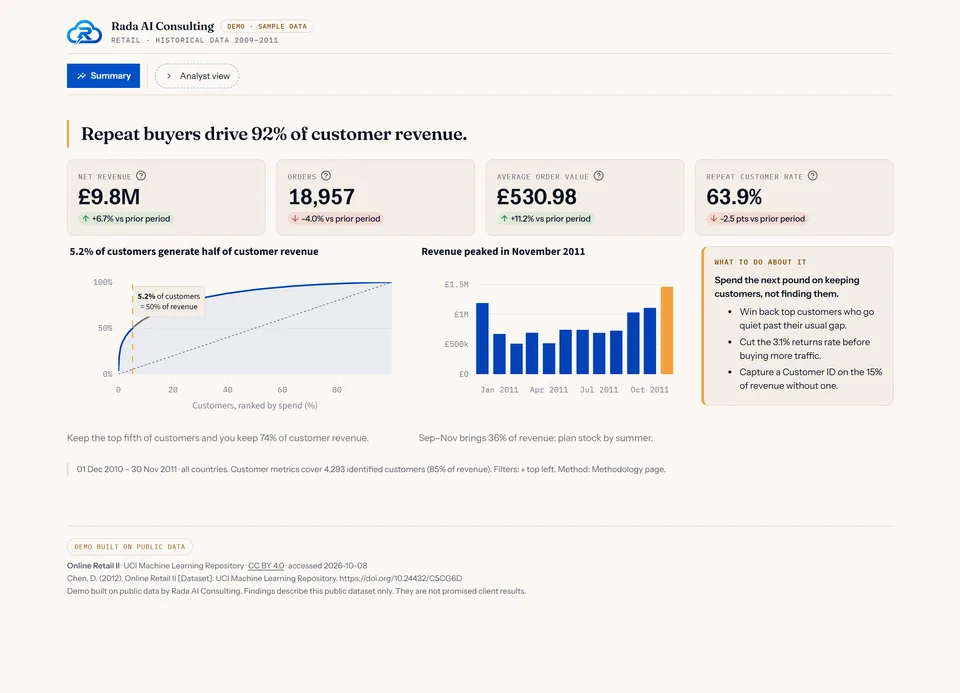 Proof of Concept
Retail and E-commerce Intelligence
- Goal
- Grow profit by protecting the customers and products that carry the business, and putting marketing money where it returns the most.
- Data
- Online Retail II, UCI Machine Learning Repository. CC BY 4.0.
- Dashboard
- Six pages: executive summary, revenue and seasonality, products, customer segments, countries, and a full methodology. Filter by date and country; download any table as CSV.
- Insight
- 4.4% of identified customers bring in half of all customer revenue, and 97% of it comes from people who bought more than once.
Source: Chen, D. (2012). Online Retail II [Dataset]. UCI Machine Learning Repository. https://doi.org/10.24432/C5CG6D
Read the full case study → Proof of Concept
Workforce, Overtime and Retention
- Goal
- Find out where overtime concentrates, who is at risk of leaving, and when it’s cheaper to hire than to keep paying time-and-a-half.
- Data
- Employee Compensation, DataSF (San Francisco Controller’s Office). PDDL (public domain).
- Dashboard
- Six pages: executive summary, pay structure, overtime risk, workforce movement, pay bands, and a full methodology. Filter by fiscal year, service area, department and job family; download any table as CSV.
- Insight
- Half of all overtime went to 5.2% of the staff, and the overtime bill grew 103% in nine years while base pay grew 61%.
Source: City and County of San Francisco. Employee Compensation [Dataset]. DataSF. https://data.sf.gov/d/88g8-5mnd
Read the full case study →
Want to see what this looks like with your numbers? Start with a Quick-Start Data & Automation Assessment, in two weeks.
Start with the assessment
Wondering what this would look like on your data?
A free call, no slides. Tell us what takes up the most hours in your week, and we will tell you honestly whether it can be fixed and what it would take.
All examples use sample data: public datasets with their sources cited, or made-up firms. No client data, ever.