

Case study · Online Retail II (UCI)Proof of Concept
Retail and E-commerce Intelligence
Live dashboard
May take up to 30 seconds to wake.
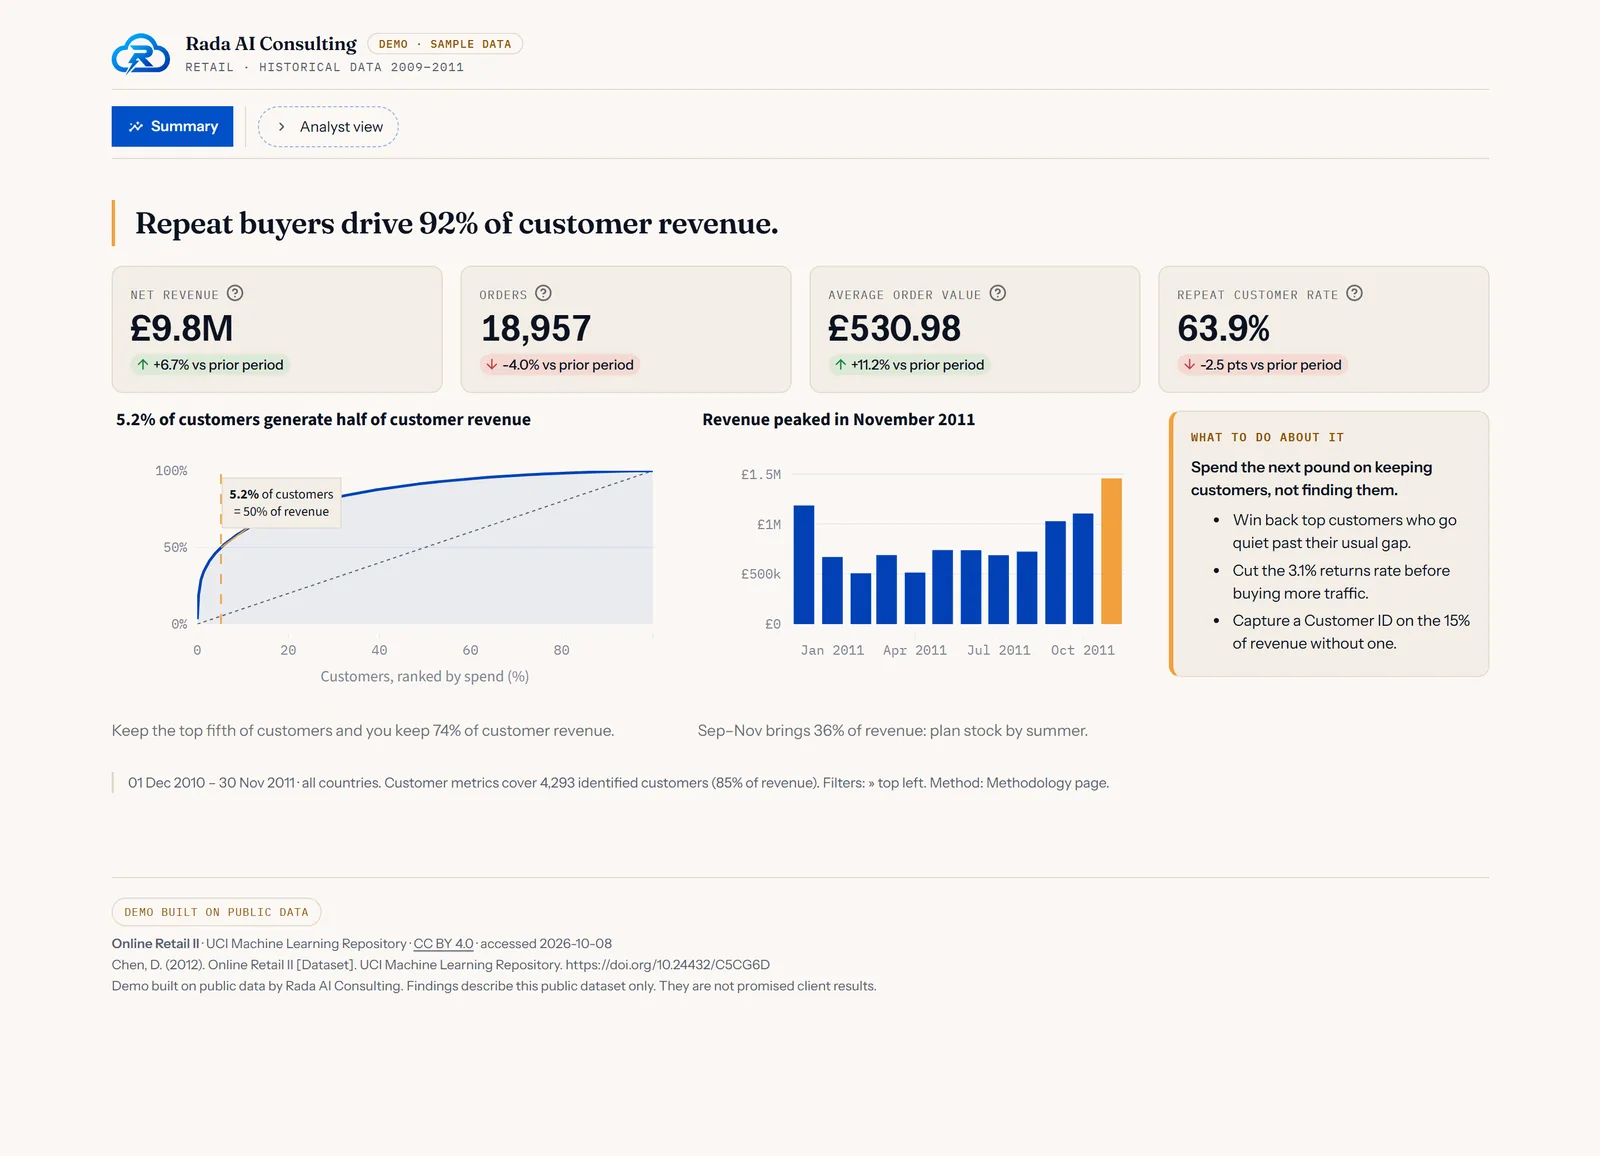
4.4% of identified customers bring in half of all customer revenue, and 97% of it comes from people who bought more than once.
Six pages: executive summary, revenue and seasonality, products, customer segments, countries, and a full methodology. Filter by date and country; download any table as CSV.
Figures here cover the full two-year dataset. The live dashboard opens on the last 12 months, so its figures differ (for example, 5.2% and 92%).
Proof of ConceptSource: Chen, D. (2012). Online Retail II [Dataset]. UCI Machine Learning Repository. https://doi.org/10.24432/C5CG6D License: CC BY 4.0. Changes made: we combined the two yearly sheets, removed rows with a non-positive price, separated cancellations as returns, left postage and fees out of product analysis, and aggregated the rest.
02
Business goal
Grow profit by protecting the customers and products that carry the business, and putting marketing money where it returns the most.
A UK online gift retailer sells thousands of products to thousands of customers in more than forty countries. Revenue looks healthy in total. The owner wants to know what is underneath it: which customers matter, which products carry the business, how predictable the year is, and where to spend limited time and marketing money.
03
Data
- Dataset
- Online Retail II, UCI Machine Learning Repository
- License
- CC BY 4.0, commercial use with attribution
- 1,067,371 transaction lines, 1 December 2009 to 9 December 2011
- 39,516 orders, 4,730 products, 43 countries
- 22% of lines have no customer ID; they count toward revenue but not toward any customer metric
Citation. Chen, D. (2012). Online Retail II [Dataset]. UCI Machine Learning Repository. https://doi.org/10.24432/C5CG6D
04
Approach
Clean it, and say exactly how
Both years combined. Cancellations kept and reported as returns rather than quietly netted away. Postage, fees and adjustments removed from product analysis, because left in, postage ranks near the top of the product list. Every rule is tested and listed on the dashboard’s methodology page.
Concentration before anything clever
Pareto curves for customers and products answer the first question an owner has: how much of the business depends on how few people and products.
Seasonality and a forecast with honest ranges
A seasonal decomposition separates the trend from the yearly rhythm. The forecast (Holt-Winters) shows its uncertainty as a widening band, and the dashboard hides it entirely when a filter leaves too little history to be honest about.
Customers in segments you can act on
Recency, frequency and spend (RFM) segments, monthly cohort retention, and lifetime-value bands, computed on identified customers only.
05
What the data says
- of identified customers bring in half of customer revenue
- 4.4%
- of customer revenue comes from people who ordered more than once
- 97%
- of the year’s revenue lands in September to November
- 34.8%
- of products account for 80% of product revenue
- 21.6%
This is a repeat-buyer business
More than a quarter of identified customers (27.6%) ordered once and never came back, and together they account for just 3.3% of customer revenue. The top 10% of customers bring in 63.2%. Acquisition matters less here than keeping the customers who already come back.
The year is decided in the autumn
September to November carries 34.8% of annual revenue. Stock, staffing and cash planning all need to be set by late summer, not reacted to in October.
A long tail of products does very little
About a fifth of products earn 80% of product revenue. The rest are not necessarily worth cutting (some bring customers in), but they should be a decision, not an accident.
One market dominates
The UK accounts for 85.7% of revenue. The other forty-two countries are worth looking at for growth, but none of them is yet large enough to carry the business.
06
What a business would do with this
Protect the top customers first
Give the few hundred highest-value repeat customers a named contact, early access before the autumn peak, and a check-in when their order rhythm slips. Losing one of them costs more than winning several new ones.
Plan the peak in July
Use the forecast range, not a single number, to set autumn stock and staffing, and review it monthly as the season approaches.
Make the second order the goal
Since one-time buyers contribute almost nothing, the most valuable marketing message is the one that turns a first order into a second.
Review the product tail once a year
Look at the bottom 80% of products by revenue, keep the ones that bring in new customers or sell alongside best-sellers, and retire the rest.
Limits of this analysis
- This is a public dataset from one retailer, more than a decade old. The findings describe that business; they are an example of the method, not a promise of results for any other business.
- Customer metrics cover identified customers only, who account for about 87% of revenue.
- Returns are matched to the period they were made in, not to the original order.
- Currency is shown as GBP; the dataset has no currency field and is from a UK retailer.