

Case study · SF Employee Compensation (DataSF)Proof of Concept
Workforce, Overtime and Retention
Live dashboard
May take up to 30 seconds to wake.
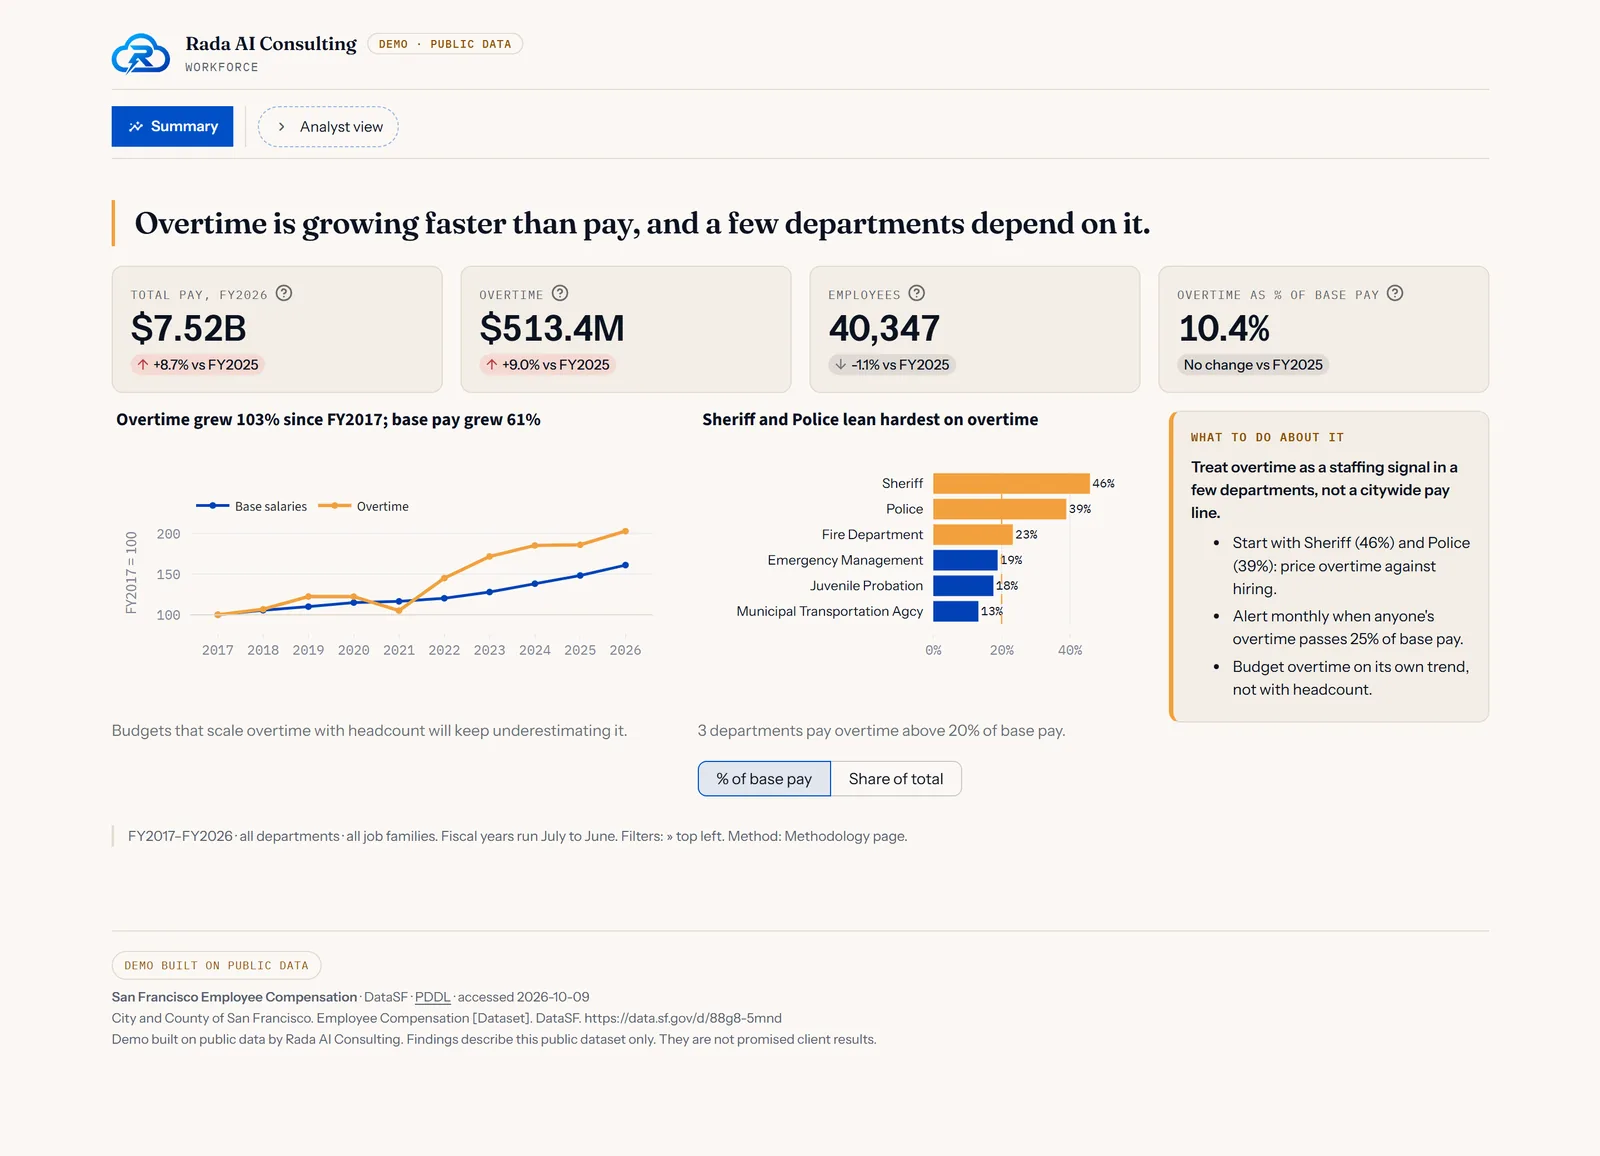
Half of all overtime went to 5.2% of the staff, and the overtime bill grew 103% in nine years while base pay grew 61%.
Six pages: executive summary, pay structure, overtime risk, workforce movement, pay bands, and a full methodology. Filter by fiscal year, service area, department and job family; download any table as CSV.
Proof of ConceptSource: City and County of San Francisco. Employee Compensation [Dataset]. DataSF. https://data.sf.gov/d/88g8-5mnd License: PDDL (public domain). Changes made: we limited it to fiscal years 2017 to 2026, harmonised departments by code, removed employee names and aggregated the rest.
02
Business goal
Find out where overtime concentrates, who is at risk of leaving, and when it’s cheaper to hire than to keep paying time-and-a-half.
Every firm that bills time or works to deadlines has the same blind spot. Overtime shows up as one line in the accounts, but it’s carried by a handful of people, and they’re often the ones closest to burning out or leaving. A CPA firm sees it every busy season; a law firm sees it in its associate ranks. To show the method on real numbers, this dashboard uses a large public payroll: ten years of San Francisco’s, covering more than 40,000 people across fifty departments. Read departments as practice groups or service lines and the questions are the same: where is overtime concentrated, is it a staffing problem in disguise, how fast do people leave, and how wide does pay run inside the same role?
03
Data
- Dataset
- Employee Compensation, DataSF (San Francisco Controller’s Office)
- License
- PDDL (public domain), commercial use permitted, no attribution required (we credit DataSF anyway)
- 423,383 payroll records for fiscal years 2017 to 2026, from a release of 1,180,053 rows last updated 5 October 2026
- 40,347 people paid in FY2026, $7.52B in total compensation, 51 departments, 57 job families
- The source names every employee. Names are dropped in memory before anything is saved; only department and job-family totals are stored
Citation. City and County of San Francisco. Employee Compensation [Dataset]. DataSF. https://data.sf.gov/d/88g8-5mnd
04
Approach
Privacy first, and tested
Names are replaced by an anonymous number in memory, used only to tell whether the same person appears in two years, then aggregated away. Automated tests feed known names through the real pipeline and fail if any trace of them reaches a saved file.
One decade, one consistent definition
Fiscal years 2017 to 2026 only: earlier years have no names to follow people by, no hours, and different department labels. Departments are harmonised by code, so a renamed department keeps one line of history.
Overtime as a share of what it sits on
Overtime is compared with each department’s base salary, flagged above 20%, and traced to the people who earn it: how few employees account for how much of the bill.
Honest about what payroll cannot say
Attrition is inferred from employees disappearing between years, never presented as confirmed departures. Pay is hidden for any group of fewer than ten people, and every comparison shows its sample size.
05
What the data says
- of employees earned half of all FY2026 overtime
- 5.2%
- growth in overtime since FY2017, against 61% for base pay
- 103%
- of overtime is paid by five departments
- 87%
- overtime on top of base salary in the Sheriff’s department
- 46%
Overtime is concentrated in a few people
About 2,100 employees, 5.2% of the workforce, earned half of the $513M overtime bill in FY2026. The 4,804 people whose overtime came to a quarter or more of their own base salary took 70% of it.
And in a few departments
Police, the Municipal Transportation Agency, Public Health, Fire and the Sheriff pay 87% of all overtime. In the Sheriff’s department overtime added 46% on top of base salary in FY2026, up from 29% in FY2017; in Police it added 39%.
It is growing faster than the payroll
Overtime roughly doubled between FY2017 and FY2026 while base pay grew 61% and headcount barely moved. Police overtime more than tripled, from $51M to $163M.
About one in ten people leave each year
Inferred from employees disappearing between years, about 10% of the people paid in one year are not on the payroll the next. The rate peaked at 13.3% after FY2019. Seasonal and temporary roles push some departments far above that, by design.
06
What a business would do with this
Price overtime against hiring
Where overtime passes 20% of base pay in a team or practice group, compare a year of that overtime with the cost of one more hire. Hours bought at time-and-a-half are often the dearer way to buy them.
Watch individuals, not only the total
Flag anyone whose overtime passes a quarter of their base pay, every month and especially through busy season. Sustained overtime at that level is a burnout and retention risk as well as a cost, and it’s invisible in a firm-wide total.
Budget overtime on its own trend
Here overtime didn’t grow with headcount or base pay, so a budget that scales it with either keeps coming in short. Forecast it from its own history, season by season.
Measure departures properly
Payroll can only suggest who left. Joining it to HR records, or to exit dates in your practice-management system, turns an inferred turnover rate into a real one, with reasons attached.
Limits of this analysis
- This is one city’s public payroll, used because firms’ payroll data is private. The findings describe San Francisco; they show the method, not a promise of results for any firm.
- People are matched between years by name. Two employees with the same name are merged, and a name change looks like a departure, so attrition is an estimate.
- The data has no gender, ethnicity or age, so pay equity here means spread within a job family, not demographic pay gaps.
- Dollar figures are as published, not adjusted for inflation.